What Is a Visualizer in Music?
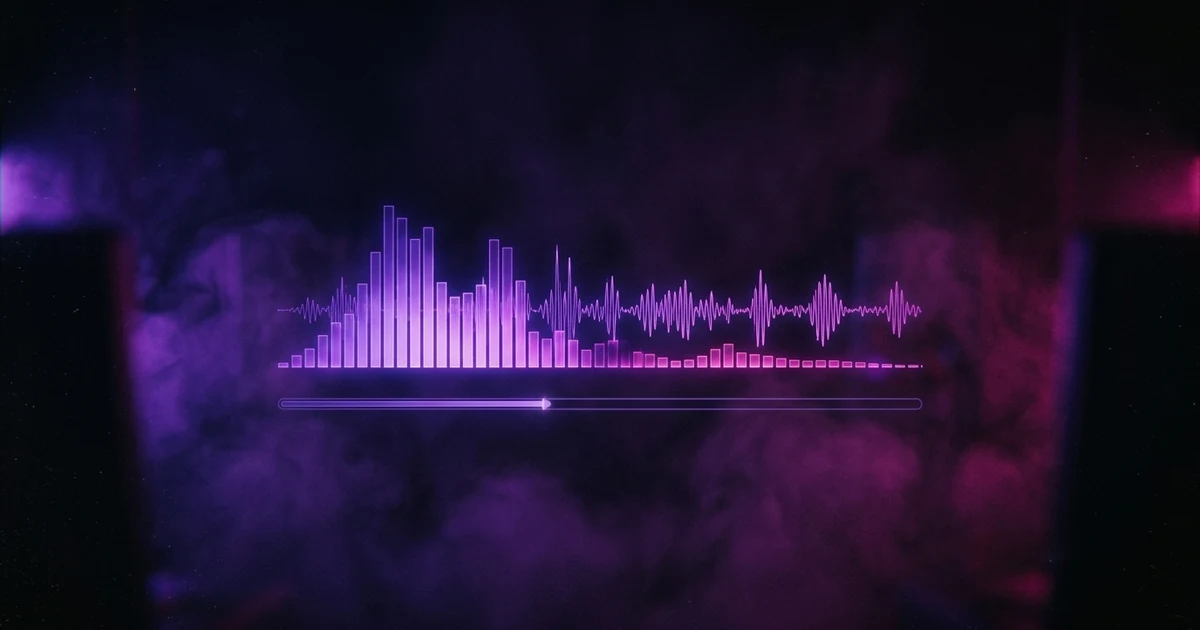
A visualizer is a video generated from a song's audio rather than filmed or drawn — bars, waveforms, particles or shapes that move in time with the sound. Because the picture is derived from the track itself, it can be produced in minutes, costs nothing to make, and requires no camera, actors or location. It also carries no subject matter: nothing happens in it, and the same template applied to two different songs produces two videos that look essentially alike. Artists upload them because a song needs a moving image to exist on YouTube, Spotify Canvas or TikTok at all, and a visualizer is the cheapest way to give a track a surface. The word is used loosely for several related formats, and the distinctions matter when you are deciding what to make.
The short answer: A visualizer is a video generated from a song's audio rather than filmed or drawn — bars, waveforms, particles or shapes that move in time with the sound. Because the picture is derived from the track itself, it can be produced in minutes, costs nothing to make, and requires no camera, actors or location. It also carries no subject matter: nothing happens in it, and the same template applied to two different songs produces two videos that look essentially alike. Artists upload them because a song needs a moving image to exist on YouTube, Spotify Canvas or TikTok at all, and a visualizer is the cheapest way to give a track a surface. The word is used loosely for several related formats, and the distinctions matter when you are deciding what to make.
Where the word comes from
The term predates streaming. If you used Winamp or Windows Media Player in the late 1990s, you met a visualizer without being told what it was called: the plugin that filled the window with reacting geometry while a track played. (If you are here to decide between one of these and a proper video, the side-by-side comparison is the more useful page.) Those were real-time, generated on your machine, and existed purely as something to look at.
The modern usage moved the same idea from playback to publishing. Instead of reacting on your computer while you listen, the reaction is rendered once into a video file and uploaded. The mechanism did not change — the picture is still derived from the audio — only where it ends up.
What is actually happening under the hood
A visualizer reads two properties of the sound, and everything you see is built from them.
Loudness over time. The signal's amplitude, sampled many times a second. This is what a waveform display draws directly, and what makes a graphic pulse on the beat: the amplitude spikes when the kick lands.
The balance of frequencies. The audio is broken into frequency bands many times a second, and the energy in each band is measured. This is what spectrum bars show — bass on the left, treble on the right, each bar's height being how much energy the track carries there at that instant. A kick drum lights the left of the display; a hi-hat lights the right.
Everything else is presentation. Particles, geometry, colour cycling and camera moves are all driven by those same two streams of numbers. That is the whole method, and it explains both the strength and the limit: it will always be in time with the music, and it will never be about anything.
One consequence worth knowing if you make one yourself: most tools deliberately ignore the top of the frequency range. Analysis reports evenly up to half the sample rate, so on a normal file the upper half of the spectrum covers roughly 11–22kHz — where recorded music has almost nothing. Draw all of it and most of your screen is a flat line, which makes a loud track look dead.
The four things people call a visualizer
The word is used loosely, and the differences change what you should make.
The reactive graphic. The strict definition: bars, waveform or particles driven by the audio. Generated, not composed.
The static image with a waveform. Very common on YouTube — your cover art, held for the length of the track, with a small reacting bar along the bottom. Technically a visualizer, though almost all of the screen is doing nothing.
The looping animation. An abstract clip that repeats for the whole song and may not react to the audio at all. Often called a visualizer because it serves the same purpose, but nothing is being visualised.
The AI-generated video. Increasingly labelled a visualizer by tools that produce imagery from a prompt and a track. This is a different thing wearing the same word: the picture has subject matter and was not derived from the waveform. Worth naming, because it is where the confusion currently sits — and it is closer to making a music video with AI than to anything on this page.
Why artists upload them
Mostly because the alternative is not uploading at all.
YouTube will not accept a bare audio file, and it remains where a great many people go to hear a song they have just been told about. Spotify Canvas needs a short vertical loop. Instagram and TikTok are video-first. A track with no moving image simply has fewer places to exist, so the visualizer is the cheapest way to clear that bar for catalogue tracks, beat uploads, livestream backdrops and B-sides.
The honest limit is that clearing the bar is all it does. Nobody shares a spectrum animation, because there is nothing in it to tell a friend about. That ceiling is inherent to the method rather than a matter of execution — a better palette does not raise it.
Which is the useful way to decide: use a visualizer when the job is to give audio a surface, and make something with subject matter for the release you actually want remembered. Most artists end up wanting both, usually in that order — a visualizer on release day because it is ready now, and a real video when the track earns one.
Making one
You do not need to buy anything. Our free audio visualizer runs entirely in your browser: load a track, choose bars, waveform or a radial spectrum, and record the result as a video with the audio included. There is no account, no watermark and no upload — the file is analysed and recorded on your own device.
Three practical notes. Recording happens in real time, because the browser captures the animation as it plays, so a three-minute song takes three minutes. The output is WebM, which YouTube accepts directly — Instagram and TikTok both want MP4 or MOV, so convert it before uploading there. And use Chrome or Firefox: Safari's recording support is patchy and can fail on the export even when the live preview plays fine.
If you want to understand where the format stops being the right choice, the full comparison with music videos covers what each costs and what platforms expect from both.
Frequently asked questions
What does visualizer mean in music?
It means a video whose picture is generated from the audio itself. Software reads the track's loudness and the balance of frequencies within it, then drives a graphic from those numbers — taller bars where there is more bass, a wider waveform where the track is louder. Nothing in the image was filmed or drawn for that song specifically. The term is borrowed from the media players of the late 1990s, where Winamp and Windows Media Player shipped built-in visualizers that reacted to whatever you played.
What is the difference between a visualizer and a music video?
A visualizer is generated from the sound; a music video is about something. The visualizer has no subject — no people, no place, no point of view — and every song run through the same template comes out looking the same. A music video makes deliberate choices about what is on screen, which is why it costs more of everything and why people remember it afterwards. Use a visualizer when a track needs a surface to exist on a platform, and a music video for the release you actually want someone to recall.
Is a visualizer the same as a lyric video?
No. The distinction is what drives the picture: a visualizer is driven by the audio signal, a lyric video by the words and their timing. That is why a visualizer can be generated from any file automatically and a lyric video cannot — the words have to be transcribed and aligned first. Plenty of uploads are both at once.
Is a Spotify Canvas a visualizer?
Not inherently — Canvas is a slot, not a kind of content. Spotify's published spec is a looping vertical 9:16 clip of three to eight seconds, between 720 and 1080 pixels tall, as an MP4 or JPG. What you put in it is your choice, and a reactive visualizer is one common answer among several.
Do visualizers help a song perform better?
They help it exist, which is not the same thing. YouTube needs a video file, Spotify Canvas needs a loop, and most short-form platforms will not take a bare audio file — so without some moving image the track has nowhere to go. What a visualizer will not do is give anyone a reason to share it, because there is nothing in it to describe to someone else. Treat it as the floor rather than the strategy.
How do I make a visualizer for free?
You can make one in a browser with no account and no watermark. Our own audio visualizer loads your track, renders bars, a waveform or a radial spectrum, and records the result as a downloadable video with the audio included. The file never leaves your device — the analysis and the recording both run locally. Recording happens in real time, so a three-minute song takes three minutes.
A visualizer reacts to the sound. A music video shows something.
Attach your track and say what you want to see. Melodious writes the storyboard and generates the keyframes in the same run, so you see the whole thing before deciding to render.
Storyboard your song